Power BUILDER
Build Custom
Power BI Visuals
with D3 & AI
Describe any chart in plain English. Our AI agent creates production-ready D3.js visuals you can import directly into Power BI — no coding required.
Design
Describe the style and characteristics of your visual. "Build a network graph where node size reflects revenue" — that's all it takes. Iterating with prompts to refine your visual.

Generate
Our AI agent fetches documentation on D3.js modules, generates realistic sample data, and auto-repairs rendering errors within a few minutes.

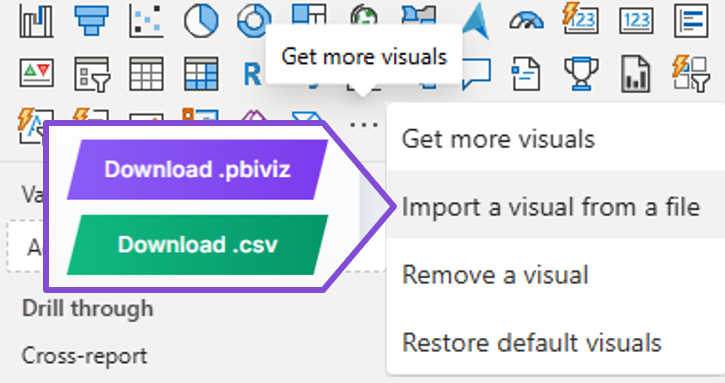
Download
One click packages your visual into a .pbiviz file. Import it into Power BI Desktop, connect your data, and share with your organization.
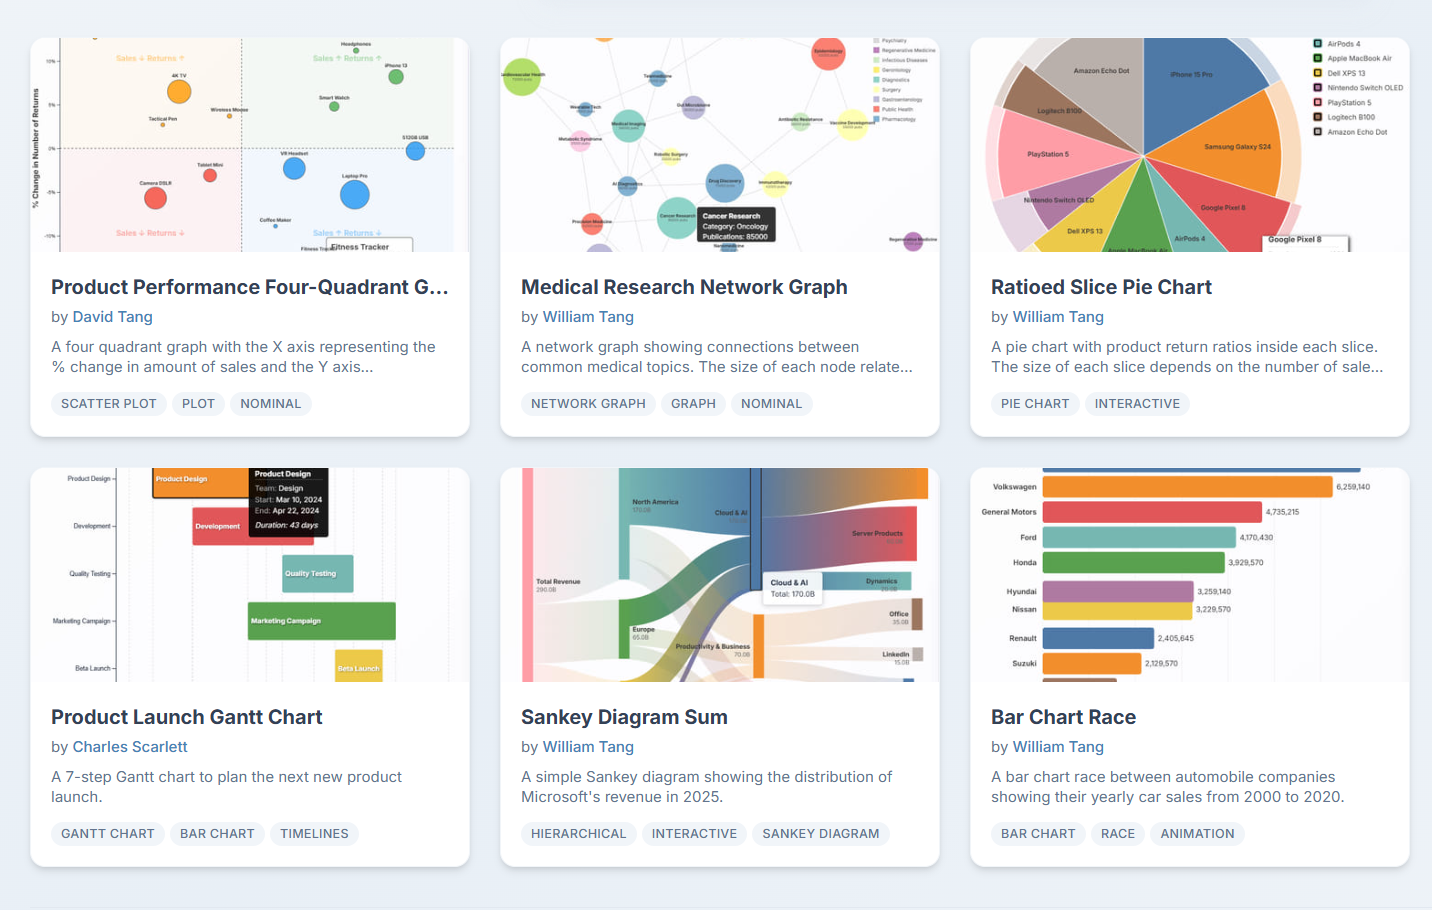
Visualizations That Speak Your Language
Scroll the wheel to explore — from simple bar charts to complex network graphs and geographic maps.
Data-Driven Documents
All the modules from the core D3 library
World Maps
Globe, continental, country and state-level maps with pre-installed GeoJSON data
Code Editor
Full Monaco editor with syntax highlighting for manual fine-tuning
Iterative Refinement
Send follow-up prompts to customize colors, layout, interactions, and data
Extensive Packages
Includes plugins such as d3-hexbin, d3-sankey, and more
Ready to Build
Quality Visuals?
Join the users already creating complex inforgraphics with AI.
Get Started Free